Analyze Process Performance in Business Central:
(1) In this blog we will get to know about the performance feature of any type of process in D365 BC. Many times, it is difficult to analyze that, at which point or logic decreases the performance of the process in the system, for this Microsoft introduces the feature “Analyze Performance”.
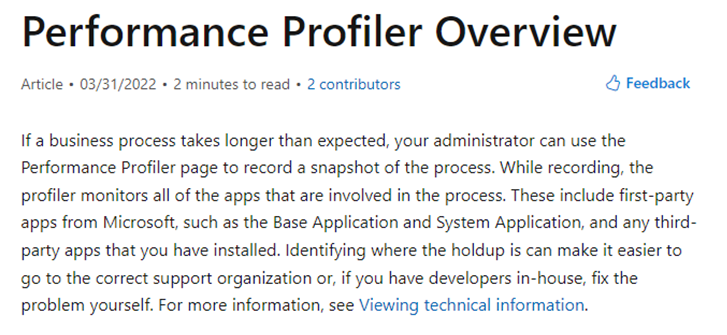
(2) For this open D365 BC, go to the Help “? ”and select Help & Support, as shown.
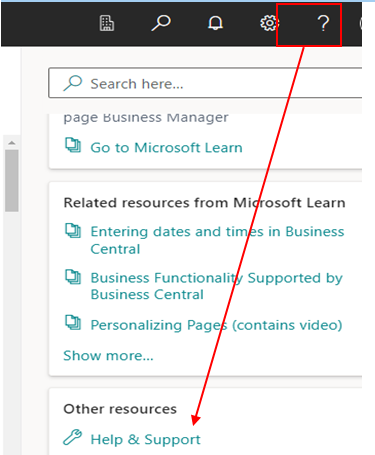
(3) After that, a New window opens, and select the “Analyze Performance” option, as shown.
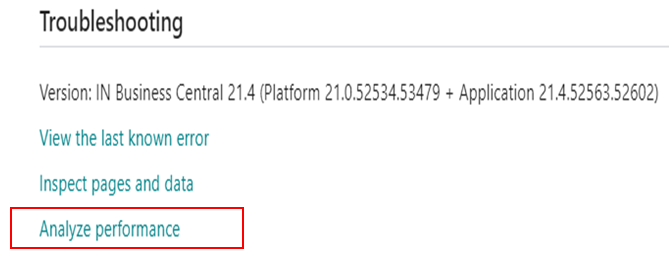
(4) Now Performance Profiler window opens as shown below.

- Start: Start the performance profiler recording.
- Stop: Stop the performance profiler recording.
- Clear: Clear the performance profiler recording data.
- Download: Download the performance profile file of the recording performed.
- Share: Copy the file to your BC folder in OneDrive and share the file.
- Upload: Upload the performance profile file to be processed.
Note: After you record a snapshot you’ll get two types of insights.
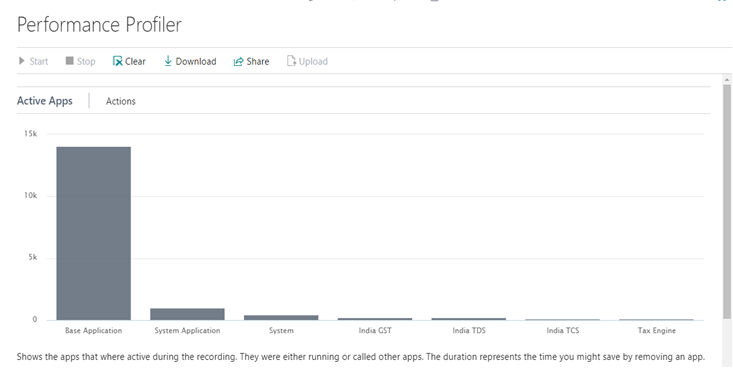
- The Active Apps chart shows how much faster the process could be if you remove each app.
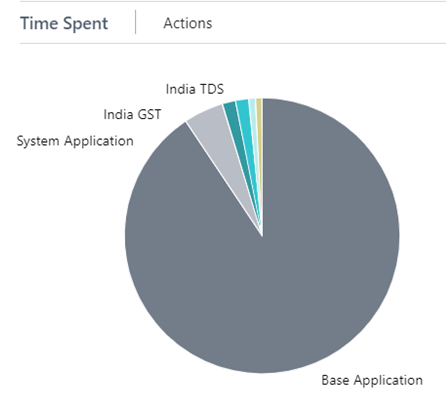
- The Time Spent chart shows how many milliseconds each app took to complete its part. This chart is available if you turn on the Show technical information toggle.
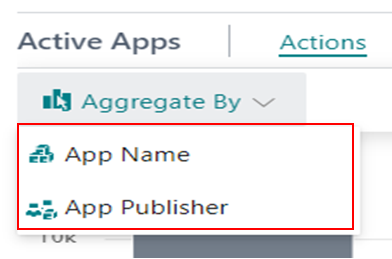
- You can use the App Name and App Publisher actions to filter the charts, for example, to view the performance of apps from a particular publisher.
(5) Now check this feature. Press the Start button to record the process, as shown.

(6) After activating the performance profile, now run the process that you want to investigate. In this blog, I will run the Item Journal process.
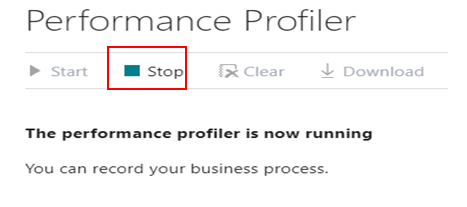
(7) After posting the Item Journal entry, now go to the Performance Profiler window and press the Stop button, as shown.
(8) Now Analysis data has been prepared, as shown.
Active Apps:
Enable “Show technical information”:

(9) After enabling the above Boolean, the system shows the details as given below.
Time Spent:
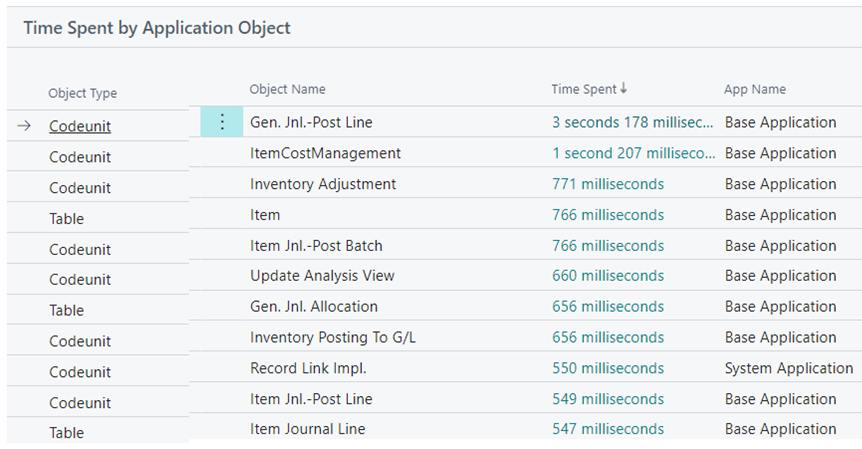
Time Spent by Application Object:
This FastTab shows the objects, such as pages, code units, and tables, that were involved in the process. The interesting things here are the Time Spent and Samples columns. The Time Spent column focuses on the object and shows how long it was active during the recording. The Samples column shows the number of times that the profiler sampled the performance of the object.
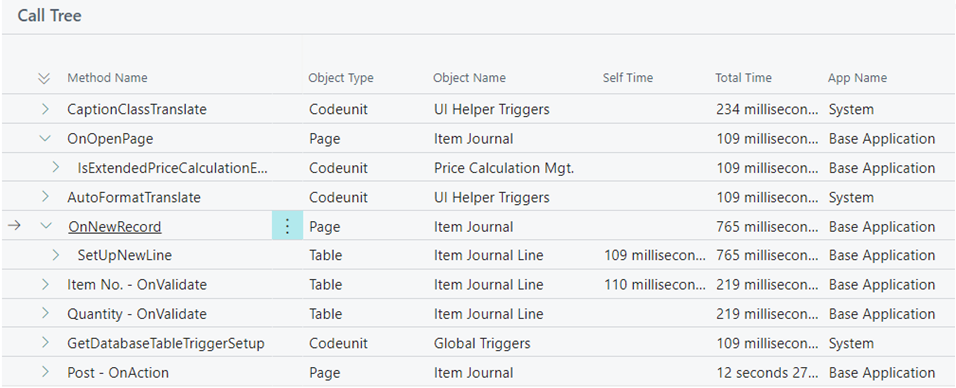
Call Tree:
The Self Time and Total Time columns show where time is spent in the code. The Self Time column shows the amount of time spent in the method only and excludes calls out of the method. The Total Time field is the Self Time amount plus calls out of the method.
(10) We can do an analysis by two categories also, as shown below.
(11) Feature Details by Microsoft:
In the 2021 release wave 2, we added the AL performance profiler to the Visual Studio Code AL experience. The performance profiler has empowered pro developers to investigate performance as part of developing new functionality, as well as help troubleshoot performance issues in AL code in customer environments, even in production.
In 2022 release wave 1, we are going to take this even further. Having this tool will make it easy for consultants and customer administrators to seamlessly perform initial performance investigations without involving pro developers, to be able to pinpoint performance issues and file support cases to the most likely owners of the app, be that a per-tenant extension, an AppSource app, or the Dynamics 365 Business Central core app. It will also be possible to share the resulting capture, making it faster for a pro developer to do further analysis without having to perform a repro of the issue locally.
The in-client performance profiler will be a new app page that can be reached on its own or from the Help & Support page. It can be opened in another browser window side-by-side with the user experience that you want to profile so that you can make sure the capture is as concise as possible and only contains the relevant steps. The page will contain actions to start and stop the capture of a user flow. You will be able to see the performance results of capture, including time spent per involved extension, top method calls, and other metrics. You’ll also be able to download the capture so that you can share it with technical support or a pro developer, for example, for viewing in the Visual Studio Code AL profiler. Note that when exporting such profile captures, you should comply with local privacy laws, such as the General Data Protection Regulation.


